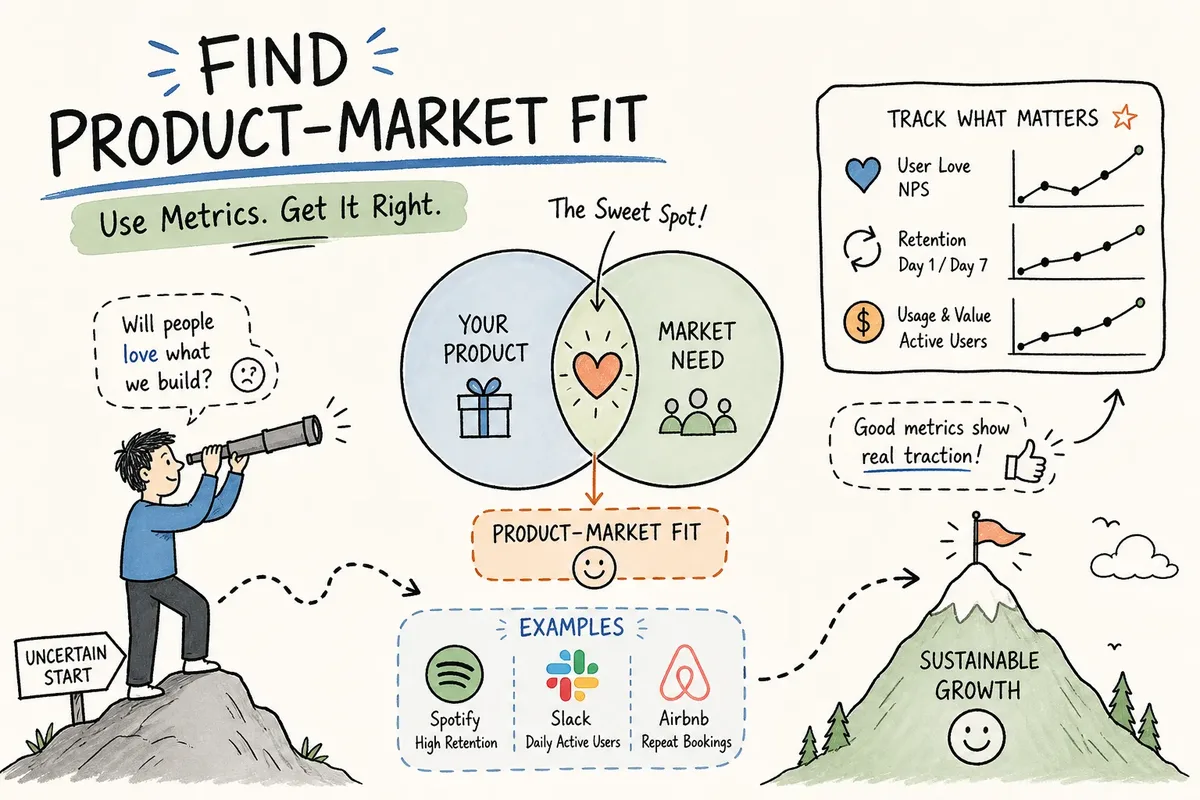
Most startups that fail do not fail because the team executed poorly. They fail because they built something the market did not urgently want. That distinction matters more than almost anything else in a founder's early journey, and it is the core of what product-market fit is actually about.
Andy Rachleff, the venture capitalist who coined the term, defined it as "a unique product offering that people desperately want." Marc Andreessen brought it into mainstream startup vocabulary in the mid-2000s, crediting Rachleff and framing it as "being in a good market with a product that can satisfy that market." Both definitions point to the same truth: PMF is a market signal, not a feature checklist.
🔑 Key Insight
By the end of this article, you will know how to define product-market fit, run a structured validation process, pick the right metrics, and confirm fit with data you can actually show investors. PMF is typically the first thing a serious investor verifies before issuing a term sheet.
What Product-Market Fit Actually Means
The Definition That Started It All
Rachleff's framing centres on desperation: users do not merely prefer your product; they need it. Andreessen's version adds an important structural point: the market itself must be healthy. A "good market" is not just large; it is growing, actively aware of the problem, and motivated to solve it. Target a shrinking or apathetic market and PMF becomes mathematically impossible, regardless of how well the product is built. For a concise encyclopedic overview, see the product-market fit entry on Wikipedia.
This is why so many technically excellent products fail. The engineering was sound but the market was not pulling. No amount of feature work changes the underlying demand dynamics of a market that simply does not care enough to change its behaviour.
Problem-Solution Fit vs Product-Market Fit
Problem-solution fit, a form of early product validation, confirms that the problem is real and urgent. It is a precursor to PMF, not a synonym for it. A founder can run 20 customer interviews, validate the pain point thoroughly, and still miss product-market fit entirely if the product is priced wrong, distributed to the wrong segment, or solving only a fraction of the real problem.
✅ Best Practice
The correct progression is: validate the problem first (market validation), then validate the solution, then confirm full market fit. Founders who conflate the two stages often scale prematurely, burning runway on a go-to-market motion that outpaces their actual validation.
Signs You Have Not Hit PMF Yet
The "Push" vs "Pull" Distinction
The most honest diagnostic a founder can run is deceptively simple: are users returning on their own, or does every re-engagement require active pushing by the team? If your team is working harder than your product, that is a reliable signal that fit is still ahead of you.
| Pull Behaviour (Good Sign) | Push Behaviour (Warning Sign) |
|---|---|
| Users share the product without being asked | Constant outreach needed to revive dormant users |
| Users pay without heavy discounts | Demos generate enthusiasm but no follow-through |
| Users return after week one without a nudge email | Team effort outpaces product-driven engagement |
The pattern that honestly describes the current state is the one that warrants attention.
Qualitative Warning Signs Founders Often Rationalise
- Low retention blamed on "onboarding complexity"
- NPS scores below zero dismissed as "early adopter noise"
- A sales cycle requiring heavy education for every single deal
⚠️ Warning
The point is not to demoralise; it is to establish that PMF has observable signals, and ignoring them extends runway burn unnecessarily. The Sean Ellis benchmark provides a quantitative mirror for these qualitative patterns: if fewer than 25% of your active users say they would be "very disappointed" without your product, the warning signs are not noise. They are data.
A Practical Process to Reach Product-Market Fit
Run Customer Interviews Before You Optimise Anything
Only interview users who have engaged with your core feature at least three times in the last seven days. Casual users cannot give meaningful PMF signals; they have not experienced enough of the product to report on genuine value. The goal of these conversations is to understand the urgency and emotional weight of the problem, not to pitch your solution. Use the 4Ps framework (Persona, Problem, Promise, Product) as a structured way to iterate across these dimensions.
Build a Concierge MVP Before Scaling Your Product
A Concierge MVP delivers the solution manually or with minimal code to test whether it genuinely resolves the problem before investing in infrastructure. The only metric that matters at this stage is whether users return unprompted and report the experience as meaningfully better than their current alternative. Run five user interviews per week alongside five small experiments per sprint, using no-code tools to move fast.
Optimise Onboarding to Shorten Time to Value
Once the MVP is validated, the primary lever for improving PMF scores is onboarding. Reducing the time between sign-up and the "aha moment" directly lifts activation rates and retention curves. If your product can solve a problem while the user is away — automated workflows, background processing, scheduled outputs — users who return to find completed work develop habits faster and churn far less.
Research on early-stage product validation suggests targeting five to ten interviews per customer segment, and up to 20 conversations in total before committing significant development resource, to surface reliable behavioural patterns. That confirmation is what justifies the next step. Founders who treat the Concierge MVP stage as a product build rather than a learning exercise almost always over-engineer before they have earned the right to scale. For a practical primer on designing and running a Concierge MVP, see this guide to concierge MVPs.
💡 Founder Tip
The healthy activation benchmark sits between 30% and 40%. Consistently low activation rates reveal a value delivery problem, not a marketing problem. Practitioner research on habit-forming software suggests autonomous value delivery meaningfully reduces early churn, though the precise effect varies by product category.
The Metrics and Benchmarks That Confirm PMF
The Sean Ellis Survey: How to Run It and What the Threshold Means
The core question is: "How would you feel if you could no longer use [Product]?" with four response options: very disappointed, somewhat disappointed, not disappointed, and N/A. The PMF score is the percentage selecting "very disappointed", excluding N/A responses.
| Score Range | What It Means |
|---|---|
| Below 25% | Significant work remains |
| 25% – 39% | Promising but not yet confirmed (some practitioners cite 20% as the lower boundary) |
| Above 40% | Strong PMF |
For a directional read, collect at least 40 to 50 qualified responses. To segment by cohort reliably, aim for 100 or more responses. Keep the total survey to four to six questions, adding follow-ups on main benefit received, target user type, improvement suggestions, and the alternatives users would switch to. Shorter surveys protect completion rates and improve data quality — a survey that users abandon halfway through is worse than no survey at all. For a practical breakdown of the score and how to run the survey, consult this Sean Ellis score guide.
Retention Cohorts, NRR, and LTV:CAC Ratios
The retention curve shape is the single most critical quantitative indicator. A curve that flattens after several weeks, rather than dropping to near zero, confirms users are returning by habit.
B2B Retention (90 days)
30–50%
Healthy range
Net Revenue Retention
>100%
Compounding PMF signal
LTV:CAC Ratio
3:1 – 5:1
Sustainable to strong
Net Revenue Retention above 100% means existing customers are expanding rather than churning, so growth does not depend entirely on new acquisition. An LTV:CAC ratio above 3:1 confirms sustainable economics; 5:1 indicates strong fit. These are lagging indicators, so they confirm PMF after the fact. The Sean Ellis survey remains the more actionable leading measure because it gives you a signal before the cohort data has had time to mature.
Real Startup Examples: What the Path to PMF Actually Looked Like
Superhuman: Iterative Segmentation Lifted the Score From 22% to 58%
Rahul Vohra's documented journey at Superhuman started at a 22% "very disappointed" score, well below the 40% threshold. The team identified that mobile professionals were the segment driving the most intense engagement. By deliberately ignoring feedback from users outside that core segment and doubling down on the features those users valued most, the score moved in stages.
22%
Starting score
32%
After initial segmentation
58%
After subsequent iterations
The key decision was not a product pivot; it was a market segmentation decision made in stages. Serve fewer people far better, rather than trying to serve everyone adequately. That principle applies across almost every PMF journey, regardless of sector.
Vapi's Pivot and Segment's B2B Transformation
Vapi pivoted its entire value proposition during its Y Combinator cohort to focus on voice AI agents, producing millions in revenue and 100,000 developers within six months. The team tracked time to value, usage depth, and feature engagement throughout, using behavioural signals rather than survey data as their primary confirmation method.
Segment changed its business model entirely to serve B2B data infrastructure needs, ultimately tracking CAC payback under 12 months and net revenue retention above 100% as confirmation metrics.
🔑 Key Insight
Across all three examples, PMF required a deliberate decision: narrow the segment, pivot the product, or change the model. It did not arrive organically by waiting for growth to materialise.
What Confirmed PMF Means for Your Fundraising Next Steps
Why Investors Treat PMF as the First Filter
Many institutional investors at seed and Series A place heavy emphasis on PMF signals alongside team quality and market size. A flattening retention curve, an NPS above 30, and a Sean Ellis score above 40% are the signals investors often look for when deciding whether to move a founder from the "interesting" pile to the "schedule a meeting" pile.
📊 Market Insight
Founders who arrive at investor conversations with clean cohort data, a documented Sean Ellis score, and a repeatable sales motion are generally in a stronger position than those who rely on narrative alone. Learn more about what investors evaluate in this breakdown of investor readiness for 2026.
PMF confirmation is the moment to shift from product iteration to capital formation. The data you have gathered is not just an internal planning tool; it is the strongest pitch you can make to any investor.
Turning Your PMF Data Into Investor-Ready Outreach
Once fit is confirmed, the practical challenge shifts from product validation to investor matching. This is where founders routinely lose weeks approaching investors who are misaligned by stage, sector, or cheque size. One approach is to use a structured matching framework that scores compatibility across these four dimensions before any outreach begins — a process covered in more depth in how to build an investor list that actually converts.
EzFunding, an AI-powered investor matching platform, applies this logic to connect founders with relevant investors, filtering by stage, sector, geography, and cheque size, so that validated PMF data reaches the right people rather than disappearing into cold inboxes. Founders on EzFunding are then matched to investors who actively write the size and stage they need, for example, firms such as Scale Venture Partners, 8x Ventures, and Dexter Capital.
If you are still deciding which stage of investor to target once your metrics are in hand, seed-investors-vs-series-a-investors-which-investors-should-you-target" style="color:#2563eb;text-decoration:none;border-bottom:1px solid #93c5fd;">this comparison of seed vs Series A investors is a useful next read. For a founder who has done the hard work of confirming PMF, the next step is making sure that data reaches the investors who are actively looking for exactly what has been built. Getting that targeting right is what separates a fast introduction from a three-month outreach cycle with no response.
Putting It All Together
Product-market fit is measurable, not a feeling. It starts with the right customer interviews filtered to high-intensity users, moves through a Concierge MVP focused entirely on learning, and is confirmed by a Sean Ellis score above 40%, a flattening retention curve, and NRR above 100%. Those numbers are not arbitrary; they are the benchmarks that distinguish genuine demand from polite enthusiasm.
The real-world cases of Superhuman, Vapi, and Segment show that the path to PMF almost always involves a deliberate decision to narrow focus rather than expand it. The founders who reached fit did so by choosing which users to serve deeply, not by trying to satisfy everyone at once. Once that confirmation is in hand, the fundraising clock starts. Use the data you have gathered — it is the strongest argument you have.
Ready to Fundraise?
Turn your PMF data into warm investor introductions
Check your fundraising readiness, then get matched to investors by stage, sector, and cheque size on EzFunding.
Sources & Further Reading
- Product/Market Fit — Wikipedia
- Guide to Concierge MVPs — Empat
- Sean Ellis Score Glossary — Learning Loop
- How Superhuman Built an Engine to Find Product-Market Fit — First Round Review
- Startup Investor Readiness: What VCs Actually Look For in 2026 — EzFunding
- How to Build an Investor List That Actually Converts — EzFunding
- seed-investors-vs-series-a-investors-which-investors-should-you-target" style="color:#2563eb;text-decoration:none;">Seed vs Series A Investors: Which Should You Target — EzFunding