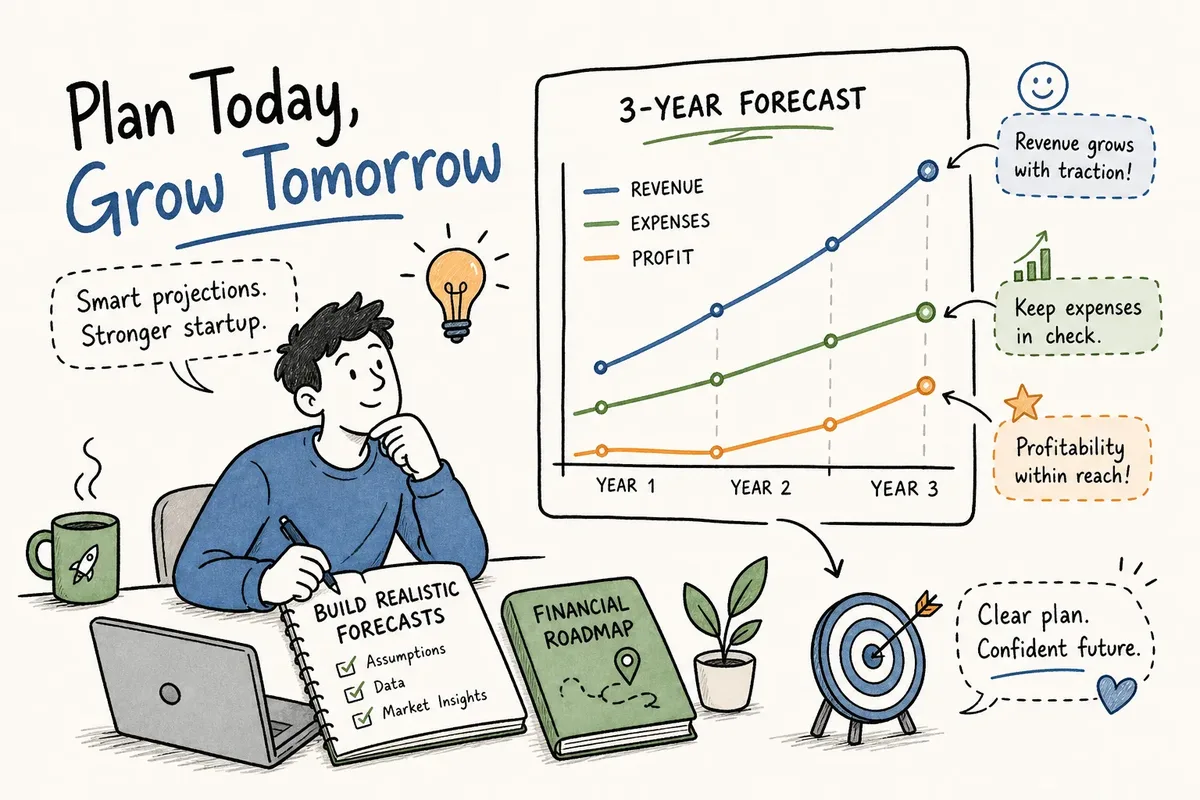
Most founders either skip startup financial projections entirely or hand investors a spreadsheet that looks ambitious on the surface but collapses the moment anyone asks a question. The financial slide is where your grasp of the business gets tested — not your vision, not your product roadmap, but your understanding of how money actually moves through the company.
Many experienced investors have reviewed hundreds of decks and can tell the difference between a founder who built their model from real assumptions and one who scaled a formula in Excel until the numbers looked exciting. This guide gives you a practical framework to build a three-statement financial model, ground every assumption in market data or operational capacity, run scenario analysis that withstands scrutiny, and present projections that hold up in a diligence conversation.
🔑 Key Insight
The goal is not a spreadsheet that looks impressive. The goal is one that you can defend, line by line.
What Investors Actually Expect From Your Startup Financial Projections
The Forecasting Window That Actually Matters
Three years is the standard horizon at seed, pre-Series A, and Series A. Year 1 should be monthly; Years 2 and 3 quarterly. Five-year projections only make sense when your growth engine is already predictable and validated, which is rare before Series A. As a practical rule, three years is standard — extend to five only if your growth engine is validated and the trajectory is defensible. Beyond that window, uncertainty compounds so quickly that most investors treat those numbers as directional at best. (fundraising/" style="color:#2563eb;text-decoration:none;border-bottom:1px solid #93c5fd;" target="_blank" rel="noopener">How many years to forecast for startup fundraising is a useful reference on choosing the right horizon.)
How Expectations Shift as the Round Gets Larger
A seed investor tolerates a bottom-up model built from first principles, with limited actuals backing it up. A Series A investor expects 12 or more months of real performance data, cohort analysis, and churn curves. If you are raising a larger institutional round, the model you built for your first cheque will not hold. The bar shifts from "directionally reasonable" to "defensible against actual numbers."
The Metrics VCs Will Stress-Test First
Before they read anything else, investors will check five numbers. If any of these figures look inconsistent or unexplained, the rest of the model loses credibility immediately.
| Metric | Target Investors Look For |
|---|---|
| Runway | 18–24 months post-raise |
| Monthly burn rate | Consistent, explainable, tied to hiring/spend plan |
| Gross margin | 70–80% for SaaS |
| CAC payback period | Under 15 months |
| Net revenue retention (SaaS) | Above 100% |
✅ Best Practice
Run your own numbers before an investor does. EzFunding's Burn Rate Calculator and Runway Calculator let you check these two figures against the 18–24 month benchmark in minutes.
Building Startup Financial Projections: The Three-Statement Model
Starting With the Profit and Loss Statement
Build your P&L from the top down: revenue line, cost of goods sold, gross profit, operating expenses (sales and marketing, R&D, G&A), and net profit. Every expense line should connect to a real decision — a hire, a software subscription, a paid channel budget. Pulling expense ratios from thin air as a percentage of revenue signals that you have not actually planned how to deploy capital.
Linking Cash Flow and Balance Sheet Correctly
The three statements are not independent spreadsheets:
- Net income from the P&L feeds into retained earnings on the balance sheet.
- The cash flow statement starts with net income and adjusts for working capital changes.
- The ending cash balance plugs back into the cash line on the balance sheet.
When this loop closes correctly, the model is internally consistent and an investor can trace any number back to its source. For a clear primer on how accounting theory connects the P&L, balance sheet and cash flow, see this guide on linking the statements together.
The Assumptions Tab That Makes or Breaks Credibility
A model without a visible assumptions tab is incomplete. Every input — pricing, churn rate, headcount timing, and CAC — should live in one dedicated tab so any variable can be stress-tested without reverse-engineering the formula structure. This is not a cosmetic choice; it is the difference between a model that invites scrutiny and one that hides from it.
How to Model Revenue Drivers and Unit Economics by Business Type
SaaS Revenue Projections: What to Model and Why
For SaaS businesses, the core revenue drivers are MRR growth rate, average revenue per account, expansion revenue, and churn. Gross margin (target 70 to 80 per cent) and CAC payback period (target under 15 months) matter more to institutional investors than top-line growth alone.
Build your projections from your actual sales capacity and conversion data rather than anchoring to a benchmark alone. For practical frameworks on SaaS unit economics and pricing strategy, see this saas-gtm-strategy/" style="color:#2563eb;text-decoration:none;border-bottom:1px solid #93c5fd;" target="_blank" rel="noopener">piece on SaaS unit economics and pricing for growth, and to understand differences between raw MRR growth and net MRR growth consider the distinction between MRR growth rate and net MRR growth rate before you build your revenue tab.
Marketplace and Product Startup Economics
Marketplace businesses should model gross transaction volume, take rate, and contribution margin per transaction. Product and e-commerce businesses should model units sold, average order value, COGS, and repeat purchase rate. Applying a SaaS revenue framework to a marketplace business risks misleading assumptions and signals that the commercial model has not been fully mapped. It is worth getting this right before the deck goes out.
Expense Ratios and Gross Margin Benchmarks by Stage
| Stage | Typical Expense Ratio |
|---|---|
| Early-stage SaaS (investing in growth) | 85–95% |
| Mature SaaS | 60–72% |
These benchmarks help you check whether your model is structurally consistent with your stage and industry. If your projected expense ratio at seed">pre-seed already looks like a mature SaaS company's, the model is either too conservative on growth investment or underestimating costs. An executive-oriented primer on expense-ratio benchmarks and CFO considerations can help you sense-check where your model sits relative to peers.
The Projection Mistakes That Destroy Investor Confidence
⚠️ Warning: The Hockey-Stick Curve Problem
A sudden, steep growth inflection with no operational justification is the single most common red flag in any startup financial model. Investors recognise a hockey stick built from a repeating Excel formula immediately. Without a specific trigger tied to real drivers — a product launch, a sales hire, a channel partnership — the curve reads as wishful thinking. If your model shows an inflection, name exactly what causes it and show the inputs that support it.
Top-Down Market Sizing Instead of Bottom-Up Revenue Modelling
A top-down model says "the market is worth $10 billion and we will capture 1 per cent." A bottom-up model says "we can close 20 customers per month at $500 MRR with our current sales capacity." Investors trust the second version because it connects revenue to real operational limits. Top-down sizing is useful for framing market opportunity; it is not a substitute for building revenue from actual unit economics.
Ignoring Burn Rate and Runway in Your Cash Flow Forecast
Many founders build a P&L but skip the cash flow statement entirely, which means they present profitability without showing when the company runs out of money. Runway is calculated by dividing current cash balance by monthly net burn rate. Investors want to see 18 to 24 months of post-raise runway as a baseline. Without a cash flow statement, that number simply does not exist in your model.
Running Scenario and Sensitivity Analysis the Right Way
Setting Up Base, Upside, and Downside Cases
Three scenarios are the minimum acceptable standard:
| Scenario | What It Reflects |
|---|---|
| Base case | Your most likely outcome under current assumptions |
| Upside case | What happens if your primary growth driver outperforms |
| Downside case | How long the company survives if growth stalls |
A model that only presents one scenario is not a forecast; it is a wish list.
Which Variables to Stress-Test First
Focus your scenario analysis on the variables with the highest uncertainty and the largest revenue impact: churn rate, CAC, conversion rates, and average contract value. Stress-testing ten variables at once produces noise. Stress-testing three produces insight.
💡 Founder Tip
Investors want to see that you know which assumptions carry the most risk, not that you have modelled every conceivable input. Pressure-test your own CAC and LTV assumptions first using EzFunding's CAC Calculator and LTV Calculator before you build them into your scenario tabs.
Presenting Scenarios Clearly to Investors
Present your base case as the primary view and your downside case as evidence of risk awareness, not pessimism. A tornado chart or a clean side-by-side table works far better than a dense spreadsheet with colour-coded conditional formatting. Investors do not expect every projection to be accurate. They expect a founder who understands which assumptions their model is most sensitive to.
Does Your Financial Slide Actually Tell a Credible Story?
The Anatomy of a Strong Financial Slide
A strong financial slide:
- Shows three years of projections at summary level as standard, extending to five years only where growth is already validated
- Calls out key assumptions explicitly
- Highlights the funding requirement and runway
- Signals gross margin and unit economics in a single view
It does not try to display every line item on the P&L. The goal is to communicate the shape and logic of the business at a glance, not to impress an investor with spreadsheet complexity.
Validate Your Financial Projections Before You Send the Deck
Before approaching investors, validate not just the numbers but the narrative your financial slide projects. Once you are confident in the substance, a tool like fundraising-readiness" style="color:#2563eb;text-decoration:none;border-bottom:1px solid #93c5fd;">EzFunding's pitch deck analysis can help you check whether your projections are internally consistent, whether assumptions are visible to a reader, and whether the growth trajectory is credible given your stated inputs.
📊 Market Insight
Getting that structured perspective early, before your first investor meeting, means you walk in having already identified and addressed the questions a diligence conversation is likely to surface. You can also review investor profiles on EzFunding such as PointOne Capital, LetsVenture, and Marwari Catalysts to better understand typical diligence expectations and investor focus areas.
Build the Model, Then Defend It
Investor-ready startup financial projections are not about showing the biggest possible numbers. They are about demonstrating that you understand your cost structure, growth drivers, and cash position clearly enough to defend every assumption under questioning. The approach is clear: build a linked three-statement model, ground every assumption in market data or operational capacity, run multiple scenarios, and validate your financial slide before the deck goes out.
If you want to pressure-test whether your financial story holds up before an investor does it for you, EzFunding's pitch deck audit is a practical starting point. Upload your deck, receive a slide-by-slide analysis across eight fundraising dimensions, and walk into your first investor conversation with financial projections for your startup built to withstand scrutiny.
🧮 Build and Stress-Test Your Numbers: EzFunding Calculator Toolkit
Skip the Spreadsheet Guesswork
Build a pre- and post-seed financial model with EzFunding
EzFunding helps you build a full financial model for pre- and post-seed stages, generates AI-driven growth and revenue KPIs, and lets you share live updates with investors — reducing the back-and-forth of manual reporting before and after your raise.
Sources & Further Reading
- fundraising/" style="color:#2563eb;text-decoration:none;" target="_blank" rel="noopener">How Many Years to Forecast for Startup Fundraising — Equidam
- The Ultimate Guide to Financial Modeling for Startups — EY
- saas-gtm-strategy/" style="color:#2563eb;text-decoration:none;" target="_blank" rel="noopener">SaaS GTM Strategy Guide — AiSDR
- PointOne Capital — Investor Profile, EzFunding
- LetsVenture — Investor Profile, EzFunding
- Marwari Catalysts — Investor Profile, EzFunding